Typical household CO2 emissions and their breakdown into spending categories

Chances are that you have come across one of the countless available CO2 footprint calculators: you may also have noticed that they typically estimate carbon footprint on the basis of an individual (or “per capita”). And many statistics report per capita metrics, too. However, the majority of people live in a household of two or more persons, where some resources such as housing (including electricity, heating, etc.), cars (and often even meals) are shared. This means for many of us the “household” is really the relevant unit when it comes to understanding CO2 emissions.
And not only is the household a relevant unit for estimating emissions, it also offers important levers to reduce emissions significantly. In fact, indirectly more than 70% (!) of total global greenhouse gas emissions can be attributed to households, which means that emissions reduction potential coming (directly or indirectly) from households is very high.
So we asked ourselves what academic research has to say about emissions for households: how large are they? What’s their composition in contributions from transportation, home, consumption, etc.? How do they depend on household income? How do they compare across countries?
We found two relevant academic publications that we summarize in this article: one for the EU, and one for the US.
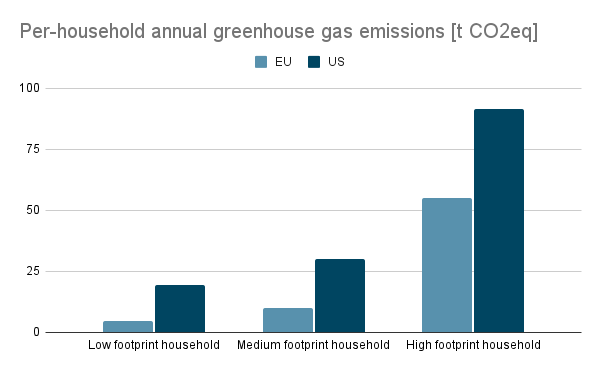
How large are typical household carbon emissions?
In the EU per-household emissions range from around 4 tons of CO2-equivalent annually to more than 50 tons per household, according to Ivanova et al., 2020. For the EU middle 40% the household footprint is just around 10 tons. (Easy to remember!)
In the US per-household emissions range from 19 up to more than 90 tons of CO2-equivalents annually, as calculated in Song et al., 2019. This paper does not specify the middle 40% to compare directly with the numbers for the EU, but we guess a typical value for the middle income bracket with most US households might be around 30 tons CO2 equivalent.
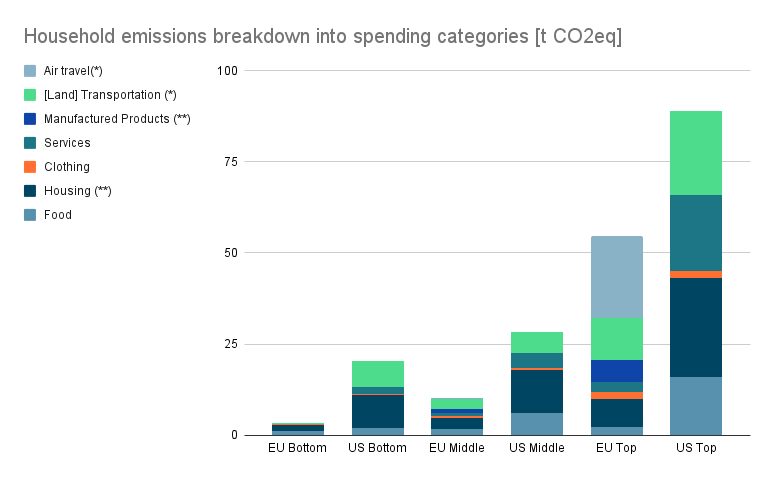
How do household emissions break down into categories?
The chart below shows a breakdown of household emissions into spending categories. We show both US and EU households, and low, medium, and high emission households. Home and transportation are the top emission categories across all types of households. The households with higher emissions correlate with higher household income (refer to the original publications for details), and emissions in each category grow substantially with income level.
Want to optimize your household’s carbon emissions?
The data also shows that across household types, housing (electricity, heating etc.) and transportation offer the biggest absolute levers for emissions reduction. The data for the EU call out air travel separately, and it is visible how air travel is a giant contributor for the high emissions of top income/emitting households.
(Disclaimers and caveats: for US air travel data it is included in the Transportation number and not separately listed! (*) Another difference is that the US data groups Manufactured products under Housing (**).
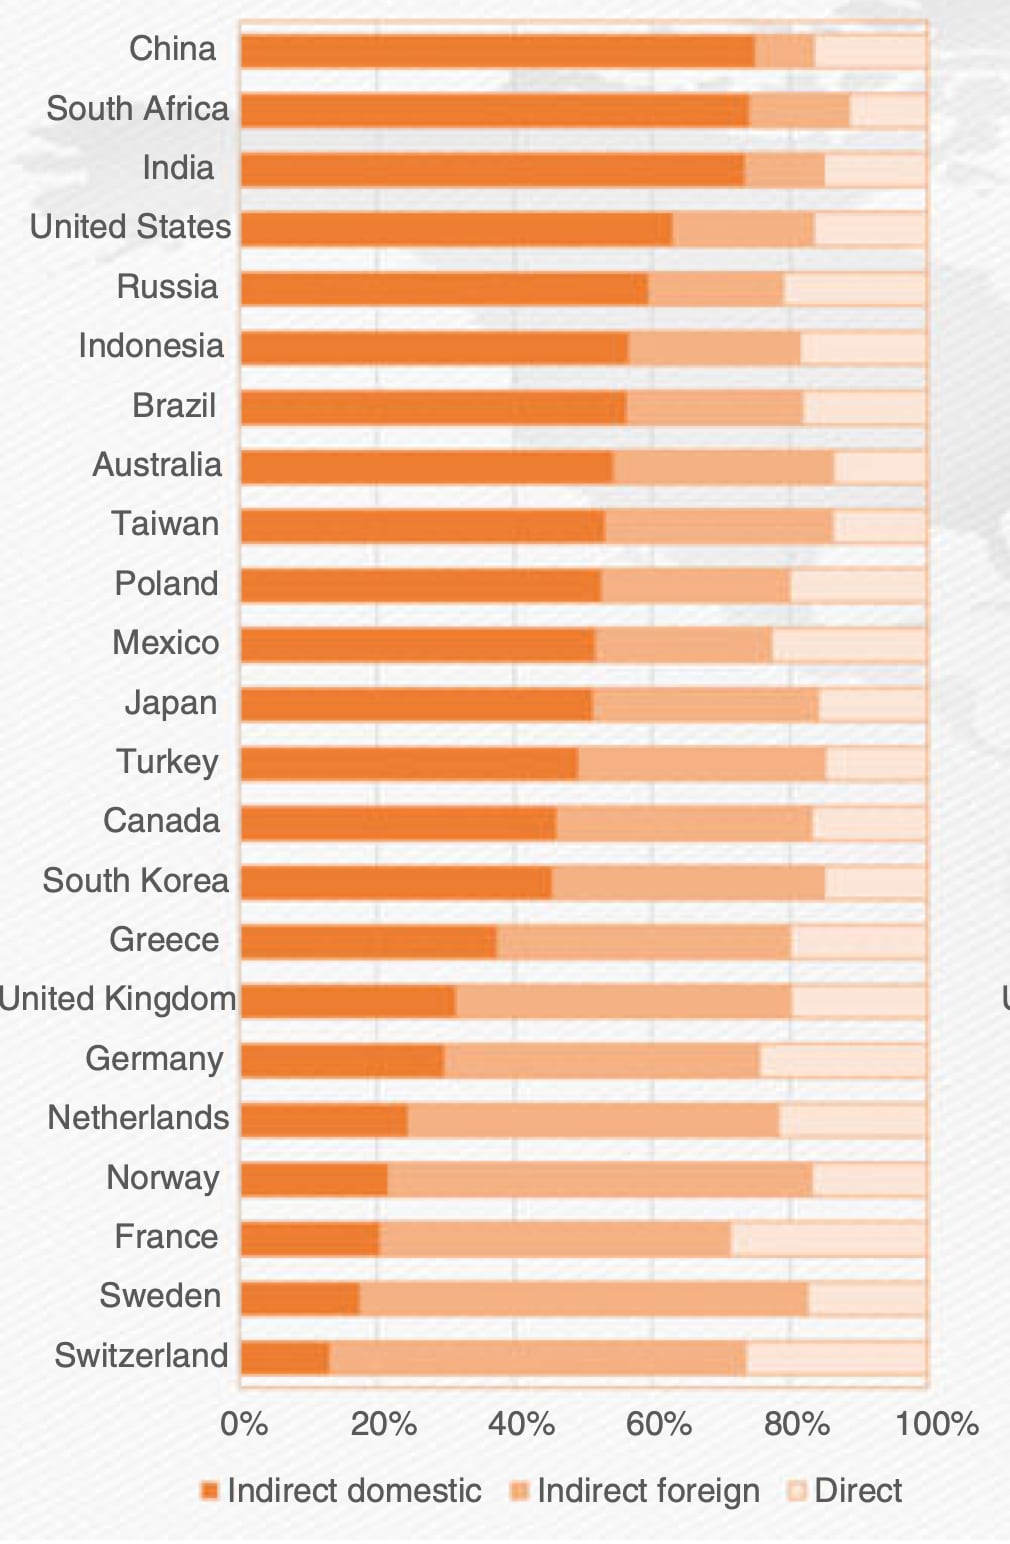
Direct vs. indirect and domestic vs. foreign emissions
Household emissions can als be characterized as direct (they are happening directly in the household, e.g. burning fuel for driving or heating), or indirect (they are “embedded” in the goods used through the supply chain, i.e. a manufactured product or a service). Further, in particular the indirect emissions can happen domestically or abroad: for example a piece of clothing worn in Europe may be manufactured in Asia, meaning all the indirect manufacturing emissions happened abroad.) The chart below taken from Ivanoval et al. 2016 nicely summarizes shares of direct, indirect domestic and indirect abroad emissions for households in various countries including EU and US.
Conclusion
Indirectly households drive the majority of emissions in the US and EU. A typical household’s carbon emissions vary significantly between the highest and lowest emission households. A average household in the EU emits roughly 10 tons of carbon dioxide equivalents annually, and an average US household 2-3 times as much. The top emissions households have significantly higher emissions than the lowest emission households, and the difference directly correlates to household income levels.
The biggest contributors to emissions in households are housing and transportation, and higher emissions households do have higher emissions across all sectors, but in particular in air travel.
References
-
Ivanova D, Wood R (2020). The unequal distribution of household carbon footprints in Europe and its link to sustainability. Global Sustainability 3, e18, 1–12
-
Kaihui Song, Shen Qu, Morteza Taiebat, Sai Liang, Ming Xu, Scale, distribution and variations of global greenhouse gas emissions driven by U.S. households, Environment International, Volume 133, Part A, 2019
-
Ivanova, D., Stadler, K., Steen‐Olsen, K., Wood, R., Vita, G., Tukker, A. and Hertwich, E.G., 2016. Environmental impact assessment of household consumption. Journal of Industrial Ecology, 20(3), pp.526-536.
-
Druckman, A., Jackson, T. (2016). Understanding Households as Drivers of Carbon Emissions. In: Clift, R., Druckman, A. (eds) Taking Stock of Industrial Ecology. Springer, Cham.