How green is your electricity? An introduction to carbon intensity
Unless you’ve been living under a rock the past few months, you’ve certainly heard about the expected critical gas and electricity supply situation in Europe towards the winter. Driven by Russia’s reduction of gas deliveries to Europe, the French Nuclear plants struggling with planned and unplanned maintenance, and particularly hot and dry summer, energy prices across Europe have been skyrocketing. These recent developments come on top of an already ongoing transition of our electricity and energy systems to achieve lower CO2 emissions.
Reason enough to look into the topic deeper: this post is the first in a series covering several topics around electricity and related CO2 emissions. Today we’ll look into the composition of grid electricity delivered to your household.
Electrify everything - the increasing importance of electricity as an energy carrier
To decarbonize our life and households, electricity as an energy carrier plays a crucial role. The overarching strategy for decarbonization in pretty much any country across the globe is to:
- Electrify everything
- Make all electricity green
- Optimize energy efficiency
Electrifying everything includes transportation (primarily ground transportation with EVs and heating (primarily switching from fossil fuels to heat pumps).
Energy efficiency is important in the short-term to tackle the current energy challenges in Europe, but also in the long-term to control the required growth in electricity generation.
Of course, electrification brings only the expected benefits if electricity comes (dominantly) from non-fossil sources, in particular wind, water, and ) (WWS).
Carbon intensity: using electricity when it is green
The grid electricity that is delivered to your house and you consume from the outlets is generated by different types of power plants. These may include coal plants, gas plants, nuclear, hydro, solar, wind, or biogas. Furthermore, especially in Europe, there is a flurry of export and import activity happening between countries.
The electricity price fluctuates with how the supply from these sources can match the demand from electricity consumers. And also the composition of the electricity changes over time, as different types of power plants provide more or less electricity over time: for example, the solar peak is around noon on sunny days, the availability of wind may vary, and some power plants have seasonal patterns or are more or less active depending on price.
All of this affects how much CO2 emissions are associated with the electricity you consume. At times when a lot of coal plants produce electricity, the associated emissions are much higher than in times of high wind, solar, or hydro production. These emissions can change quite significantly during the course of a day or over seasons as the composition of the electricity varies. And they also differ quite a bit by country.
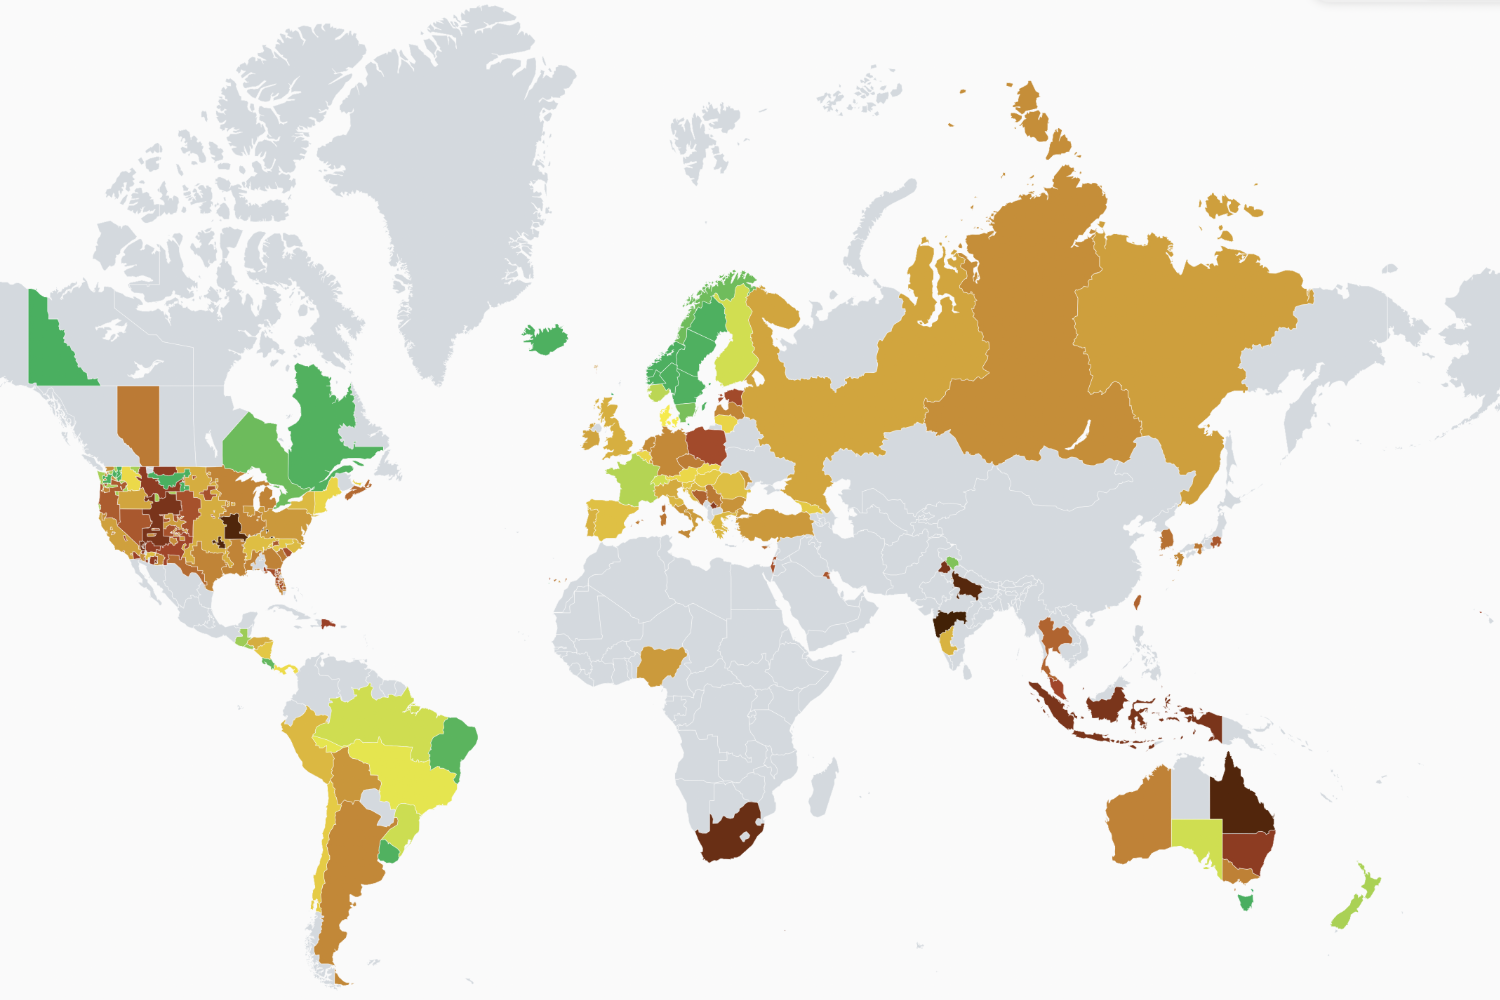
There’s an amazing service, Electricitymaps that visualizes all of this activity in real-time:
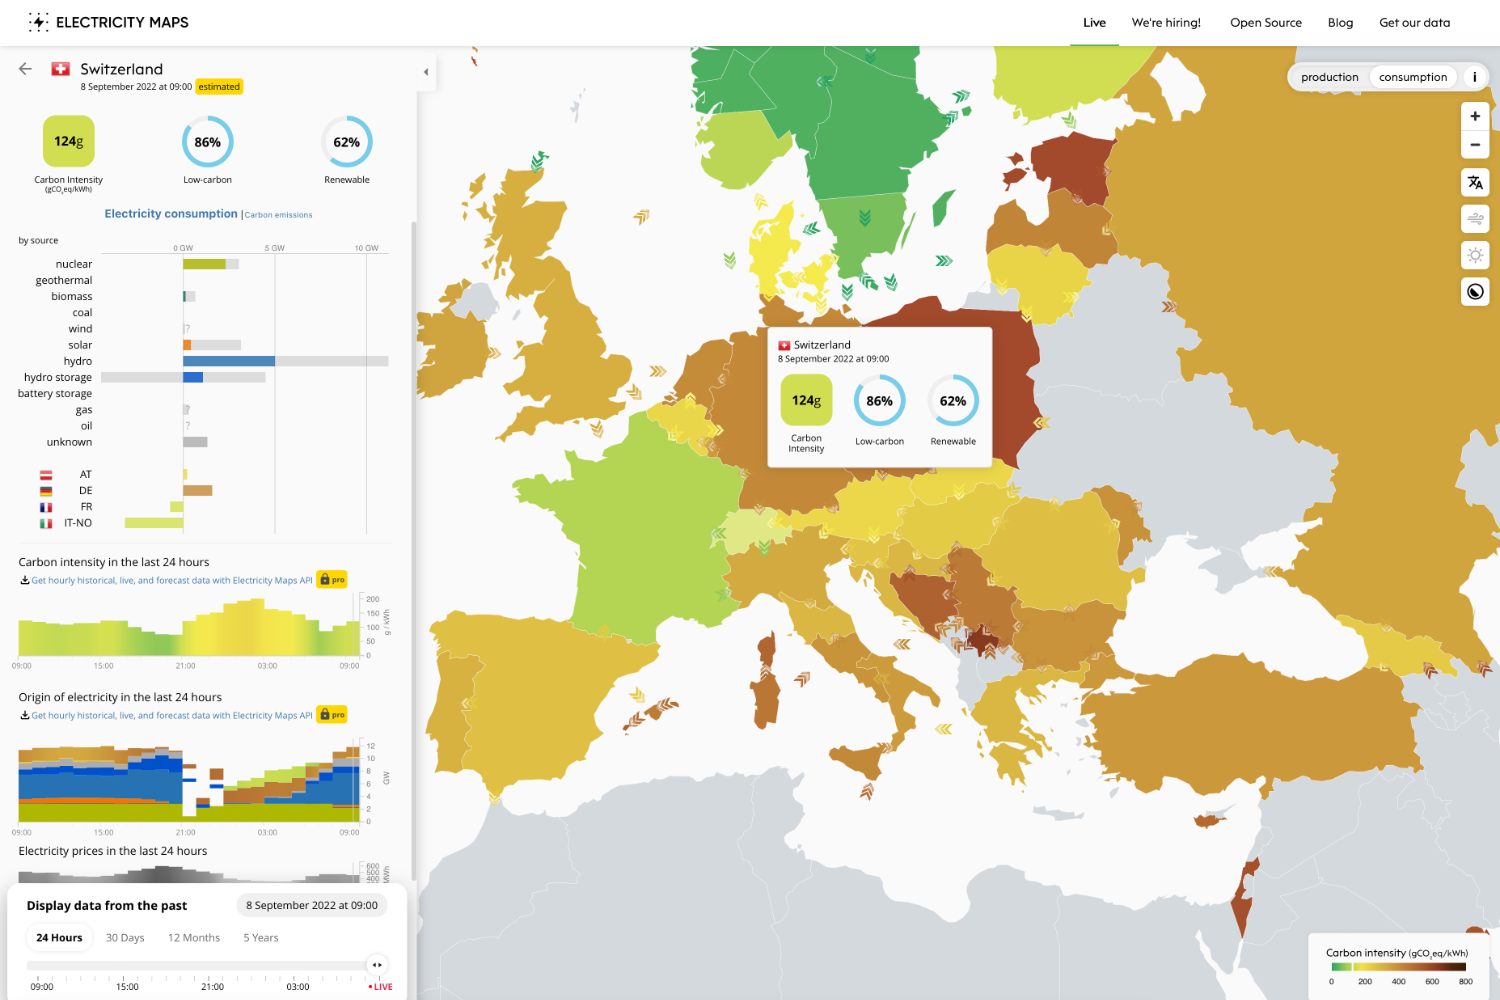
Energy providers nowadays publish digital data feeds about their electricity production. Electricitymaps aggregates all of this information, adds import and export balances, and visualizes everything on their map.
The data in particular also includes carbon intensity: this is the amount of CO2 emissions associated with each produced (or consumed) kilowatt-hour (kWh of electricity at any given time. Carbon intensity (aka CO2 intensity) is measured in grams of CO2 per kWh (gCO2/kWh).
Let’s look at a few examples of carbon intensity:
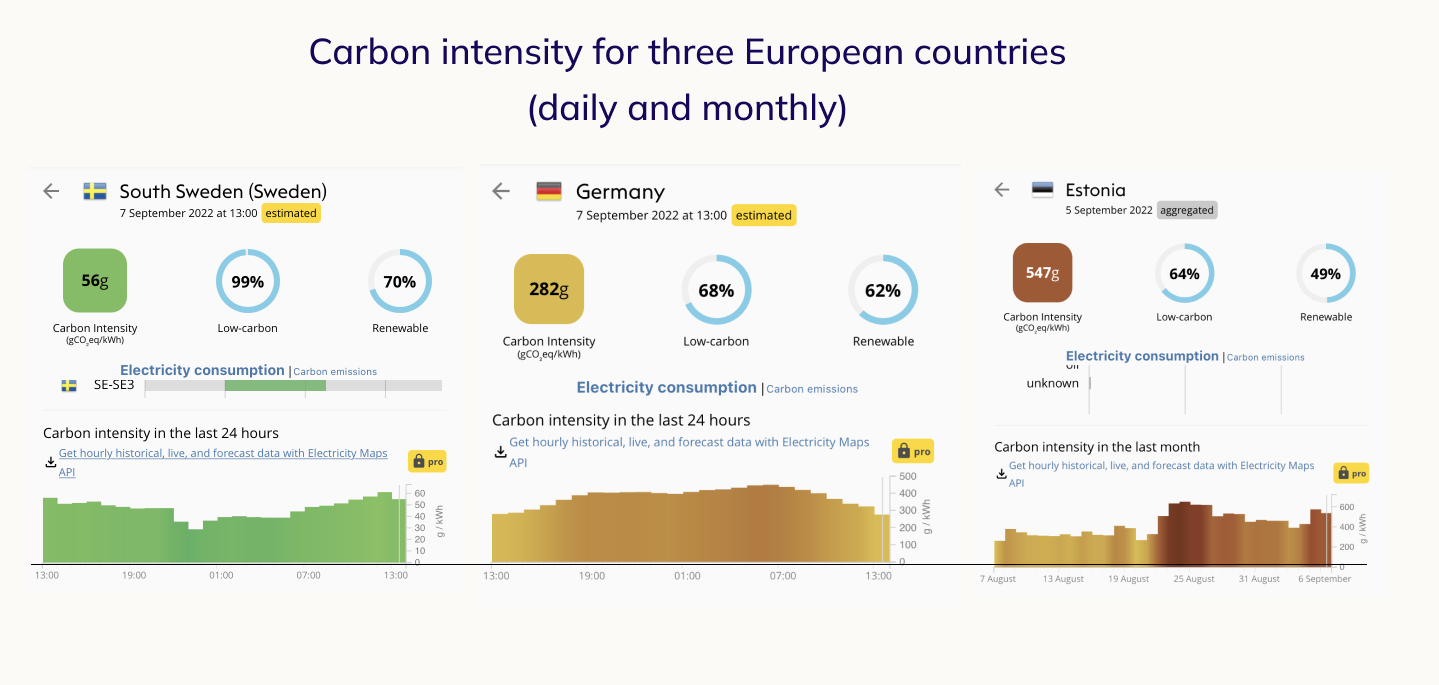
As you can see the CO2 intensity can change as much as 100% during the course of a day or a month! The typical level of carbon intensity also varies significantly between countries such as Sweden (less than 100 gCO2/kWh), Germany (around 300 gCO2/kWh) or Estonia (> 500 gCO2/kWh)
The bottom line here is: the emissions from your consumption of electricity can change quite a bit depending on when you consume the electricity. Especially for “shifteable” consumption of larger amounts such as EV charging, using a dryer or washing machine, CO2 emissions can be optimized by shifting their time of use.
Furthermore, in countries with high average grid CO2 intensity (Poland, Estonia, etc.) the absolute reductions are particularly significant, especially if you consume solar power from your roof.
Carbon intensity in the Zerofy app
Any electricity consumption in the Zerofy app is using such real-time CO2 intensity data to calculate emissions for electricity consumption. The figures below show how you can see the varying CO2 intensity for overall electricity consumption, or for specific devices if you connected any such devices through our integrations.
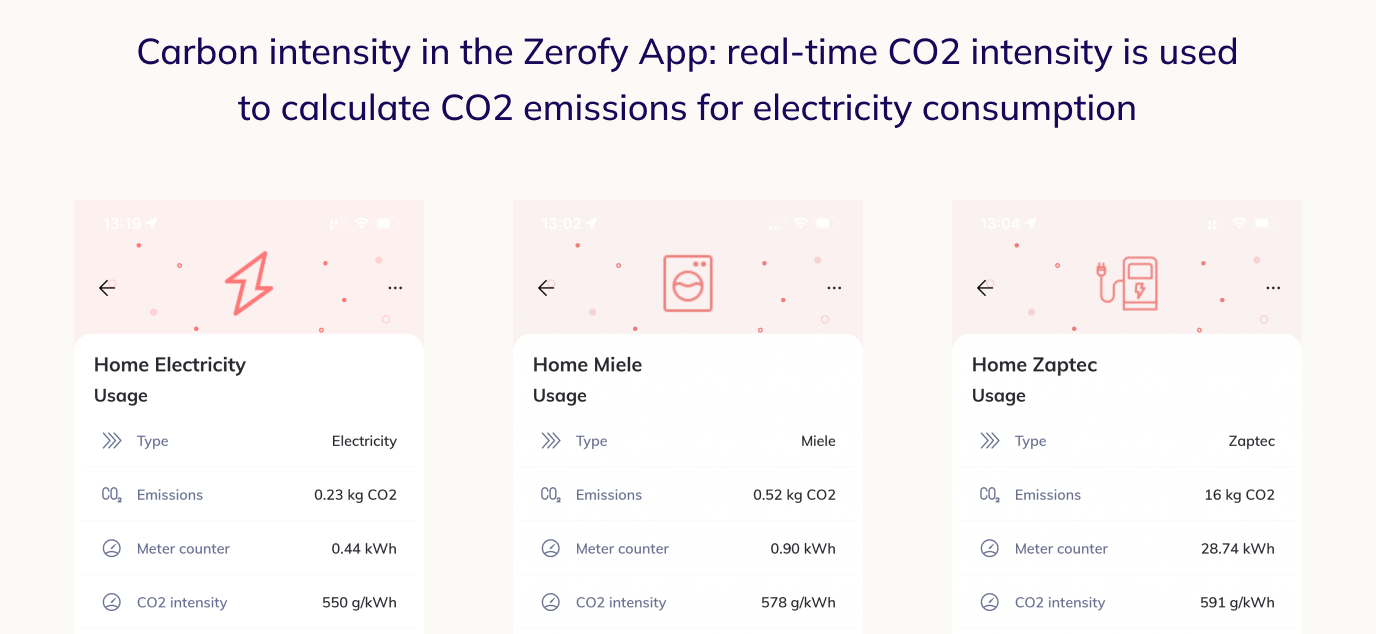
To track your household’s electricity consumption you can enter meter readings manually now and then, or you can connect smart meters, where available. (More on that soon.)
We hope this post gave you some insights on the varying CO2 impact of your electricity consumption. In upcoming posts, we’ll discuss how green energy plans work, and how you can shift your electricity consumption to optimal times to save CO2 and costs.