Building an automated and holistic carbon tracking app for households

At Zerofy our goal is to simplify a low-carbon (and ultimately zero-carbon) lifestyle. Measuring and understanding where emissions in one’s life or household come from is the first step before identifying the big levers to take action. In this article, we describe our technical and design approach toward automated and real-time household carbon emissions tracking.
How to track household carbon emissions
When designing our carbon tracking app, we have the following design principles in mind:
- Automated: no one likes to enter lots of data manually. So ideally all emissions would be tracked automatically.
- Real-time: to identify changes and patterns it’s not enough to look at a carbon footprint once a year. It’s useful to see patterns over time, and ideally see improvements as a consequence of actions.
- Holistic: it’s not enough to cover just one area of life (e.g. just transportation), because the easiest levers for impact may lay in an untracked area, and
- Granular: Data needs to be granular enough such that users can see useful patterns and derive actions. For example, knowing the total kilometers driven per month (or monthly fuel purchases) may not be enough. Similarly having one single monthly or quarterly utility consumption and carbon emission estimate is not enough to derive any insights. On the flip side knowing, say, every single detail of food emissions for every single ingredient may be too granular.
Implementation and technical details
We have built the first version of our app guided by the above principles. It doesn’t yet fulfill all our aspirations to match these principles, but we already track a large part of emissions fully automated.
To automate carbon footprint tracking, we start with the insight that modern life is increasingly represented by a set of digital data streams from your activities, devices, and services. So we simply need to hook into these data streams and convert them to an emissions representation. Here’s how we do it in our current app:
Transportation emissions tracking
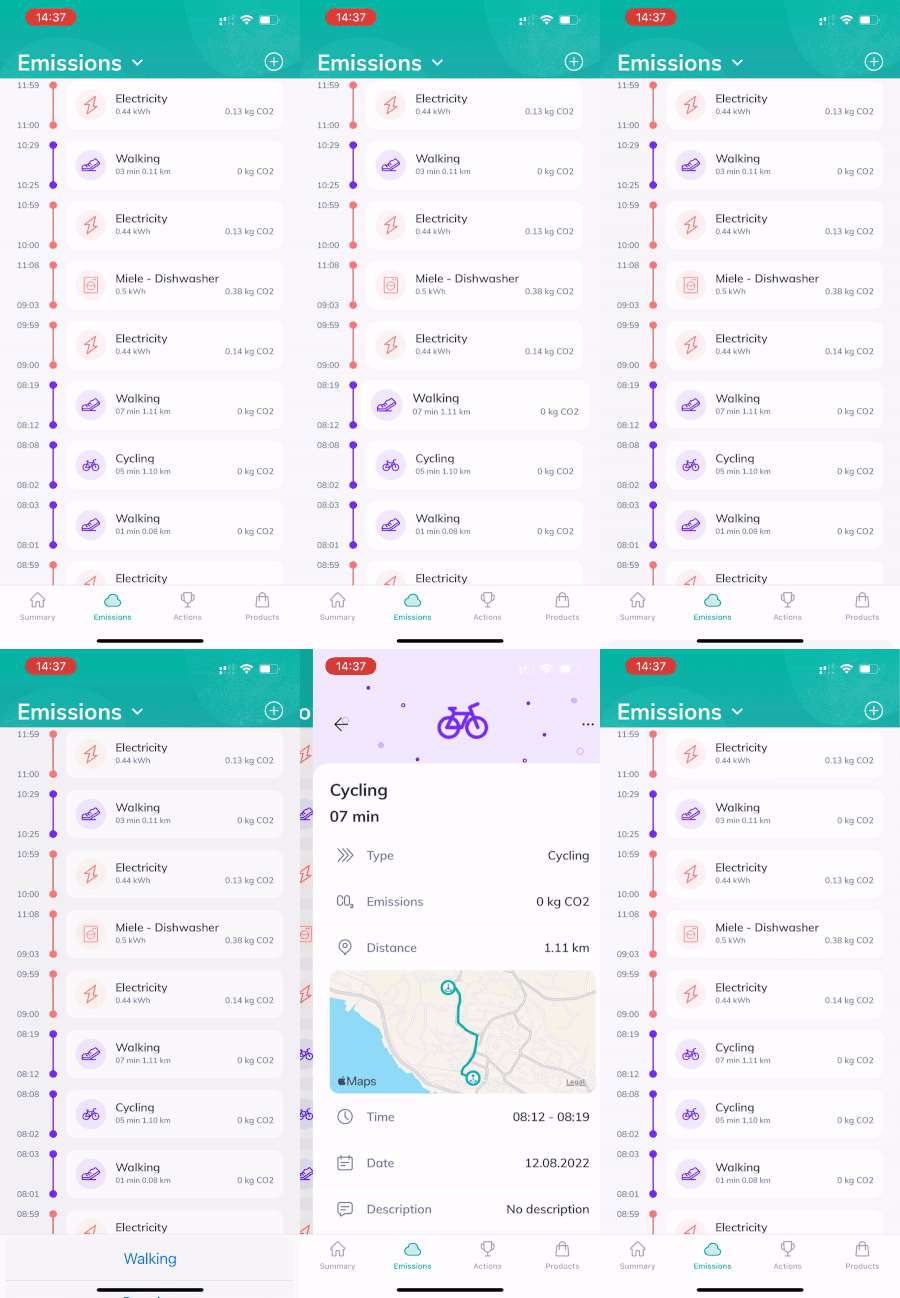
relies on analyzing your phone’s motion. Data from location services and accelerometer is classified using machine learning to identify granular transportation classes including car, train, tram, boat, cycling, walking, and even plane. By the type of transportation and the distance we can calculate total fuel consumption and from that CO2e emissions.
![]()
Some extra nifty detail we added:
- Configuring your specific car model can give more specific consumption data
- Misclassified trips can be easily changed and help the machine learning system learn

Home and energy emissions tracking
Here we intend to rely on smart meters and connected devices. Certain utilities offer API access with 15-minute or hourly live consumption values. Or certain smart meters allow direct cloud access. With this, we get electricity consumption data in kWh. We convert these kWh into CO2 emissions using real-time carbon intensity data from Electricitymaps. Besides tracking total consumption with smart meters, we also allow connecting individual devices such as connected appliances from Miele, or certain smart home devices such as EV chargers or smart plugs to collect device-specific consumption data streams.
![]()
Goods and service purchases emissions
Leveraging open banking APIs we can analyze transaction data to identify purchases of certain product categories (electronics, fashion, furniture, etc.). Most open banking services offer categorization, but it can be refined with custom machine learning models. There’s research on how to then convert a dollar amount spent in a given category into emissions estimates using economic input-output life-cycle assessment (EIO-LCA). We leverage this type of research to calculate emissions. In order not to double count we skip transactions in certain categories, for example, fuel purchases that are already covered by transportation tracking, or utility bills that are covered by metering data.
![]()
Food emissions tracking
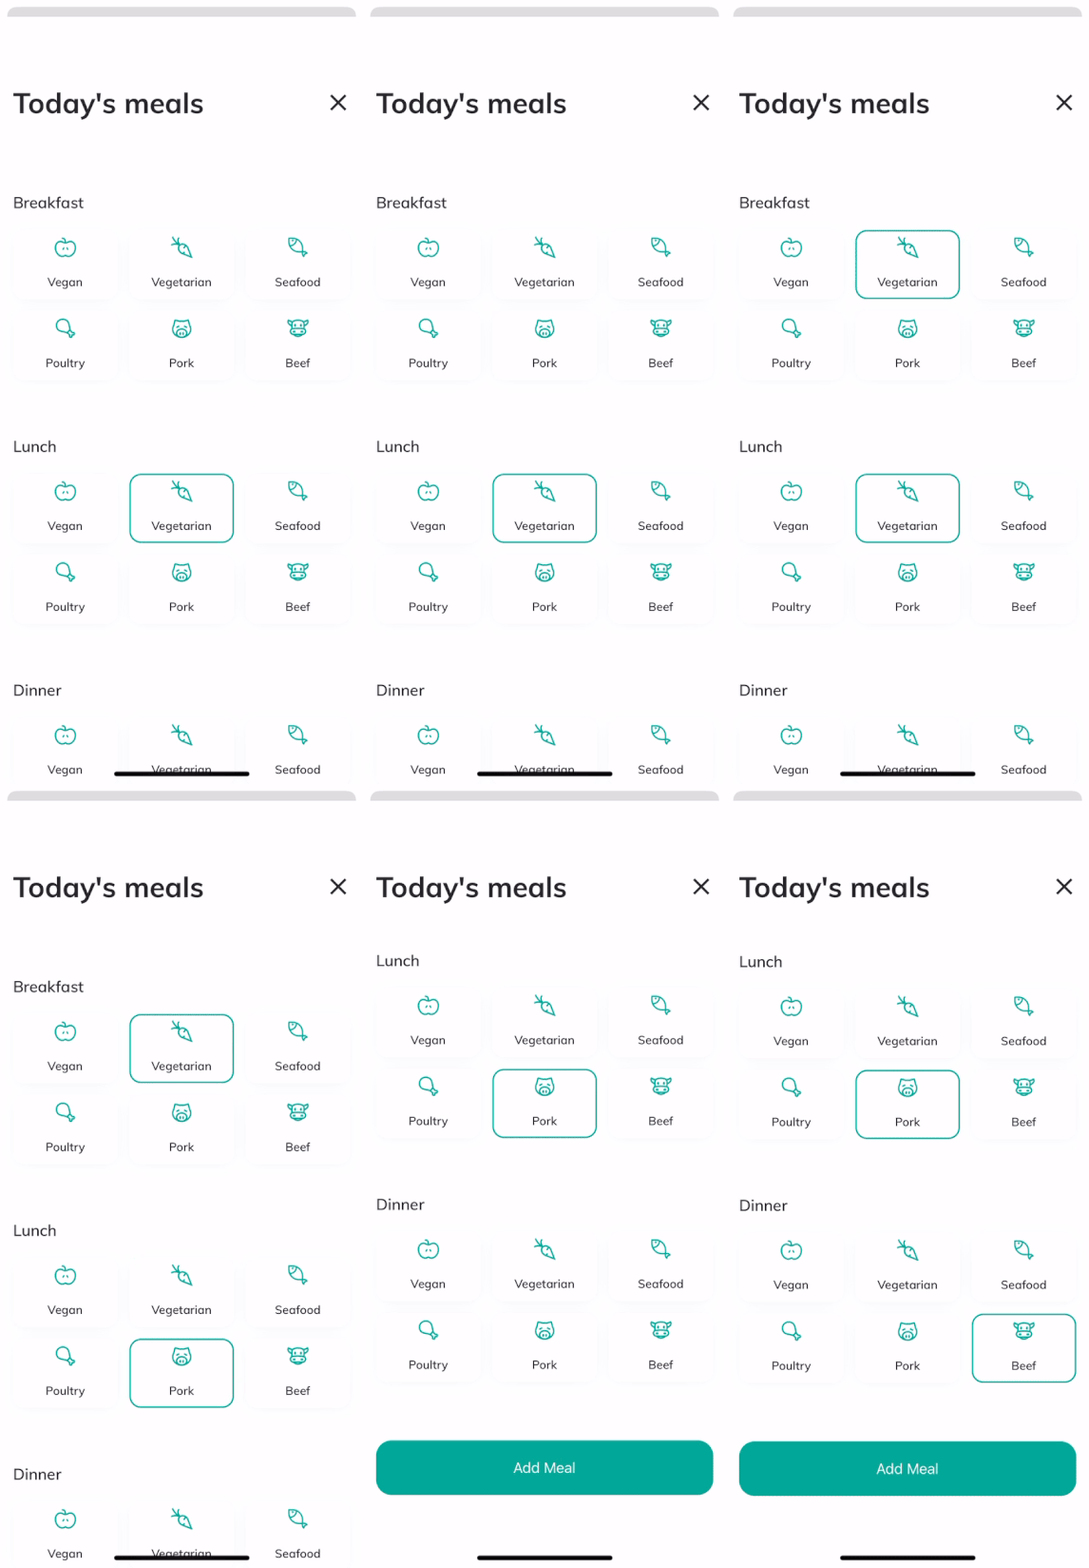
Food emissions tracking is the hardest of the four emissions categories, as emissions are defined by meals’ ingredients. While for a good-enough estimate it’s sufficient to know if a meal was vegan and contained any meat and its kind (chicken, beef, etc.), even that information cannot be trivially and efficiently obtained in an automated way, yet. Hence here we fall back to manual entry. But nobody likes tedious manual data entry, so we simplify the UI to the minimum possible with a simple entry mask:

With this simplified UI, entering 3 meals (at once) only takes 3-5 seconds per day. We’re also working on a machine learning prediction algorithm for the meals based on historic patterns, further reducing data entry.
We employ a similar fallback for folks who don’t want to connect credit cards but still track purchases manually. And we prefill certain data based on the country and household heuristics where no smart utility devices are connected.
Putting it all together
We put all this together in our app for iOS, and here’s a quick video overview of the current main functionality:
What’s next?
There are a few things we don’t track well yet, and that we are planning to add:
- Heating data. Will become relevant towards fall in the northern hemisphere.
- We’d like to add more utility, smart-meter, and IoT API. (Let us know what to prioritize!)
- In the long-term, there may be ways to split purchases even into single products, provided we get the information (e.g. digital receipts)
- Food: avoiding manual data entry. This is the hardest category to do automatically. Deriving data from restaurant purchase transactions or grocery purchases is rather imprecise. Tracking three meals a day manually, as we do it now, is probably pretty accurate, but the manual data entry is suboptimal (even though we minimized the data entry needed).
What would you add? Please feel free to reach out with ideas!
Finally, tracking emissions is only the first step. Understanding, taking action, and reducing emissions is the next. Our app also provides solutions in this area, but we’ll discuss these in a different article.
Meanwhile, please download our app for iOS (currently available in the countries DE, CH, AT, SE, and EE) or join our waitlist for countries outside this area.
