Why should I care about home electricity monitoring?
Monitoring your household electricity use is important because it gives you the information you need to analyse and identify areas where energy is being wasted. This empowers your household to make small changes to reduce your electricity use. You can see these changes translate into lower monthly bills, as well as a lower impact home with fewer associated emissions. There are a few useful ways to monitor your electricity use we will expand on below. These tactics can help you and others in your household to become more conscious of how much energy is being used on a day-to-day basis.
Units and concepts to understand when monitoring and analysing electricity use
When beginning your journey into understanding your electricity use, you’ll sooner or later encounter two units: kW (kilowatt) and kWh (kilowatt hours).
kWh: a unit of energy.
kW: a unit of power.
kW and kWh are connected in the sense that one kWh is simply the energy that is generated by one hour of sustained power of 1kW.
Learn more about kWh and kW.
Ways to monitor and analyse home electricity use
1. Use a smart plug to track individual device’s consumption
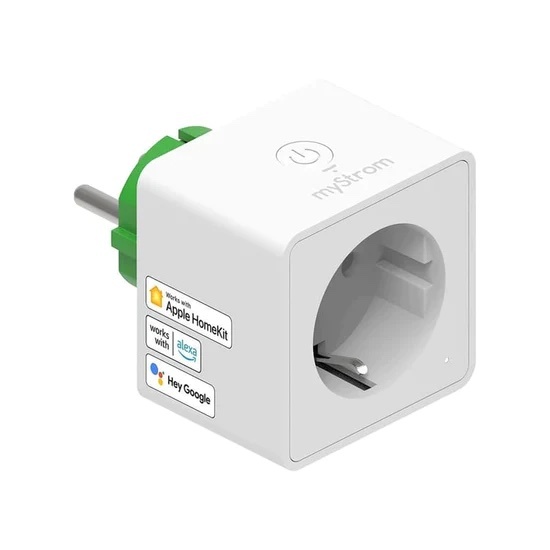
A smart plug is a device that fits in between the power socket in your wall and an appliance. They are similar in appearance to power adapters you may have used when traveling. The reason they get the ‘smart’ moniker is because these plugs allow you to control the appliance they’re plugged into remotely, enabling them to function in more environmentally efficient and useful ways.

The MyStrom Switch smart plug, available in the Zerofy Store.
The majority of smart plugs work by connecting to wifi, and then are controlled by an app or through a smart home hub, like Amazon Alexa, Google Home, or Apple Homekit. This means you’ll be able to remotely control the power going into your connected appliances, and set up automated actions. Every appliance that you have connected to a smart plug can then be visible and controllable from one place.
Related reading: learn more about smart plugs and how they work.
2. Track your meter values manually
Your electricity consumption is measured with your electricity meter. It can be installed in your house (basement or garage), in your apartment (basement or utility cabinet), or outside of your house. It shows the current total consumption state of your place in kWh. You can manually track energy consumption by noting down the meter values in regular intervals, for example once a week. You can do this with pen and paper, take a picture of the meter, or use electricity tracking apps. For example, Zerofy also offers a manual electricity meter tracking feature. Not only does it allow you to record the values and see a consumption history, it also calculates CO2 emissions.
3. Use a smart meter
A smart meter is an electronic device that records the electricity use of your household and can store and transmit it digitally (for example to your utility company). Some smart meters also enable two-way communication.
A conventional meter logs how much electricity and gas a household or business uses. They are usually read out manually by your utility company (for example monthly, or in some cases even only twice a year), which is then used to calculate your bill. A smart meter is similar in that it logs energy use. It differs significantly however, in the insights and data it can provide.
A key benefit of smart meters is that customers can get more timely and granular information on their electricity use. This can be enabled through an in-home display (common for example in the UK), which displays metering data in the home. Or it can be enabled through a web app or mobile app provided by your utility or third parties.
Related reading: learn more about smart meters and how they work.
4. View your grid carbon intensity
Carbon intensity is a useful concept to know about when monitoring your electricity use. The carbon intensity of electricity is defined as the amount of greenhouse gases emitted per unit of electricity produced, measured in grams of CO₂-equivalents per kilowatt-hour of electricity. The makeup of the electricity in your grid comes from a variety of sources, some more green than others. This means that depending on how electricity is generated, the carbon intensity of electricity you use in your home can vary significantly. For example, when electricity is being produced using coal power plants, the carbon intensity is higher and the electricity less green. When there is full sun and strong wind, renewable electricity production is higher. This means the carbon intensity of your electricity is lower, and the electricity is more green.
In many locations, you can access this information for your grid. This means you will be able to understand how green your electricity is. Electricity Maps is an excellent platform that visualizes grid carbon intensity in real-time. If you click on a location, it will provide you with key data like the carbon intensity of the electricity, the percentage of electricity that is low-carbon and renewable, plus a breakdown of production by source. Note that data is not available for some regions.
If you know your current grid carbon intensity, you can choose to perform more electricity-intensive activities when carbon intensity is lower. For example, if you want to charge your EV, bake something that requires a long baking time, or run a few loads of laundry.
Related reading: understanding grid carbon intensity
How the Zerofy app can help
The Zerofy app brings all of these electricity monitoring strategies together in one app, giving you valuable information at your fingertips.
You can:
- Connect your smart plugs and smart meter to the app, pulling in all of your data from these devices
- Get real-time insights from these above items, plus recommended actions for reducing usage
- View carbon intensity and electricity price, right in the app
Track and measure electricity consumption
Update October 2024: Read also our recent post about how to access to your smart meter data via various tools, interfaces, and APIs.